


A majority of psychologists reported an increase in the severity of symptoms among their patients. Many also reported an increased length of treatment course for existing patients—meaning that patients needed treatment for longer periods. This may be a factor in more than half of psychologists reporting that they have no openings for new patients, or many saying they have longer waitlists. Despite engaging in self-care, more than one-third of psychologists reported that they were burned out. Taken together, these findings demonstrate that psychologists are working at the limits of their capacity, and underscores the fact that some patients who need care are not able to access it quickly.
The future of the psychology workforce also is changing. Psychologists have shown themselves to be adaptable, changing their work habits during the pandemic to include fully remote or hybrid practices. Although the survey showed a small shift back toward seeing some patients in person this year, the majority of psychologists maintained hybrid practices. Psychologists also saw increasingly diverse patients with a range of racial and ethnic backgrounds, ages, sexual and gender identities, and health conditions or disabilities. Respondents also regularly participated in care teams with health professionals and behavioral health professionals.
APA’s 2023 Practitioner Pulse Survey, one in a series of surveys conducted annually since 2020, explored the nature of psychologists’ practices. This year’s survey was distributed via email to a random sample of 16,557 licensed psychologists in the United States from August 30 to September 29, 2023. A total of 561 responded to the survey.
The mental health crisis continues
According to the survey, patients are presenting with more severe symptoms, certain disorders are increasing in frequency, and the average period of time spent treating a patient is growing longer, placing a strain on psychologists’ workloads and limiting access to care. More than half of respondents agreed that they were seeing an increase in the severity of symptoms among their patients in the prior 12 months (Figure 1). While this number has stabilized since previous years, psychologists report patients are presenting with worsening symptoms year after year, indicating a continuing crisis.
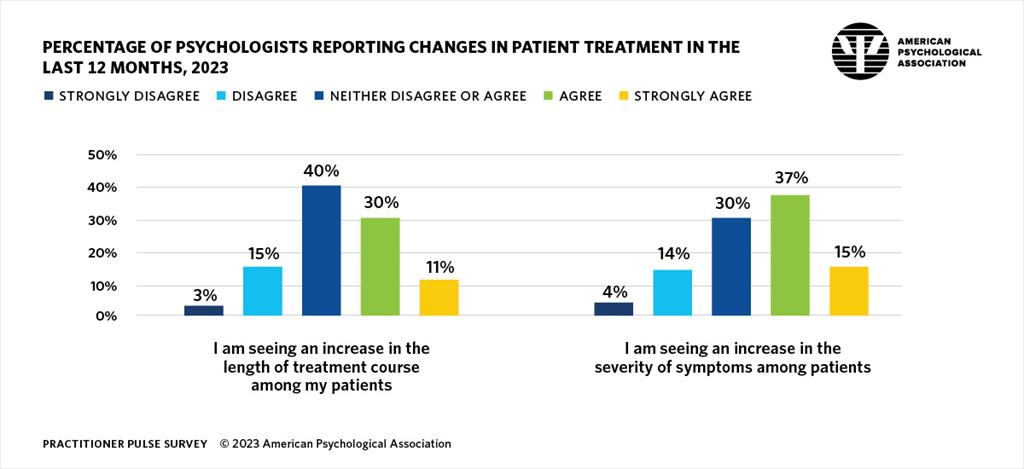
Figure 1: Percentage of psychologists reporting changes in patient treatment in the last 12 months, 2023. View a full-size version with detailed description of the changes in patient treatment infographic.
Increased symptom severity took place alongside an increase in the duration of treatment, as more than 2 in 5 (42%) psychologists agreed or strongly agreed they were seeing increases in treatment length compared with nearly 1 in 5 (18%) who disagreed or strongly disagreed (Figure 1). An increase in treatment duration means patients are being seen for longer periods of time, leaving psychologists with less capacity for taking on new patients. Psychologists have reported yearly increases in their workload since 2020 (Figure 2), though this trend showed slight improvement in 2023 (Figure 2).
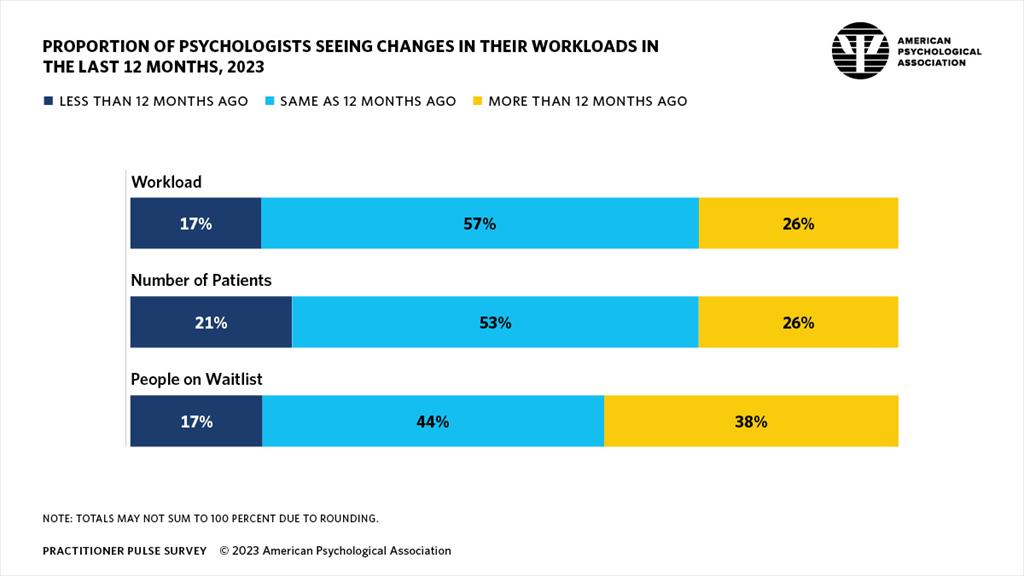
Figure 2: Proportion of psychologists seeing changes in their workloads in the last 12 months, 2023. View a full-size version with detailed description of the workload changes infographic.
More than half of respondents (56%) reported having no openings for new patients, and the same number (56%) also reported not maintaining a waitlist (Figure 2). For those who did maintain a waitlist, nearly 4 in 10 (38%) reported the waitlist had grown in the last 12 months, compared with fewer than 2 in 10 (17%) who reported it had shortened. Among respondents with a waitlist, more than two-thirds (69%) reported that the average patient waits up to three months for an appointment, while the remainder of respondents with waitlists reported average wait times longer than three months.
Similarly, psychologists reported seeing increased rates of certain mental health disorders. Compared with 12 months ago, of psychologists who treated these disorders, 68% reported an increase in patients with anxiety disorders, 50% reported an increase in patients with trauma- and stressor-related disorders, and 46% reported an increase in patients with sleep-wake disorders (defined by the American Psychiatric Association as problems with the quality, timing, and amount of sleep, which cause distress and impaired function) (Figure 3). Despite small improvements in 2023 compared with 2022, overall rates of patients presenting with any of these disorders are still increasing annually at high rates. For comparison, fewer than 8% of psychologists reported seeing decreases in any of these disorders in their patients, suggesting worsening population health. Notably, year-over-year increases of patients presenting with substance-related and addictive disorders and neurocognitive disorders grew in 2023, while increases in all other disorders shrank.
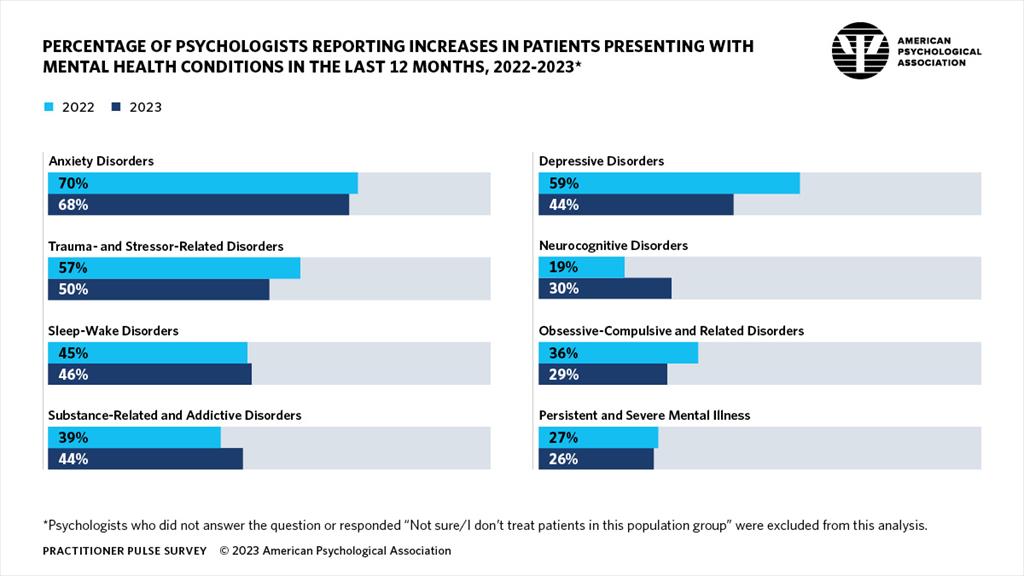
Figure 3: Percentage of psychologists reporting increases in patients presenting with mental health conditions in the last 12 months, 2022–2023. View a full-size version with detailed description of the increases in patients presenting with mental health conditions infographic.
Despite engaging in self-care, psychologists report high stress levels and rates of burnout
Amid increased need for services, psychologists reported taking measures to care for their mental health. The majority agreed that they had been able to practice self-care (73%) (Figure 4). Work-life balance was also a priority in 2023, with nearly two-thirds (63%) of psychologists agreeing they have been able to maintain such balance. Peer support and consultation were also common, with nearly half (49%) saying they have engaged in it.

Figure 4: Proportion of psychologists responding to statements about self-care and burnout, 2020–2023. View a full-size version with detailed description of the self-care and burnout infographic.
Despite these wellness strategies, more than a third (36%) of psychologists either agreed or strongly agreed that they feel burned out (Figure 4). While this figure is down from its peak in 2021 (47%), it still indicates a significant proportion of psychologists are experiencing unhealthy amounts of stress. If this trend, which has been relatively consistent for four years now, is not significantly reversed, workforce retention could suffer—psychologists could leave current jobs in search of new ones, retire early, or exit the field entirely. This could be signaled by growing proportions of respondents reporting their plans to decrease their practice hours, with 21% of respondents in 2023 planning to reduce their practice hours in the next 12 months compared with only 16% in 2021.
Most psychologists maintain hybrid or fully remote practices
While 88% of respondents reported either working in a hybrid in-person and remote practice or a completely remote practice, psychologists are shifting back toward more in-person services (Figure 5). The use of fully remote practices has been on a downward trend since its height in 2020 at 80% of all reported practices to its 2023 level of 21%. The decline in fully remote practices each year has taken place alongside an increase in the number of psychologists seeing patients both in person and remotely. The overall trend of the last four years has been a slow return to providing some in-person services, with most respondents maintaining some level of remote service provision.
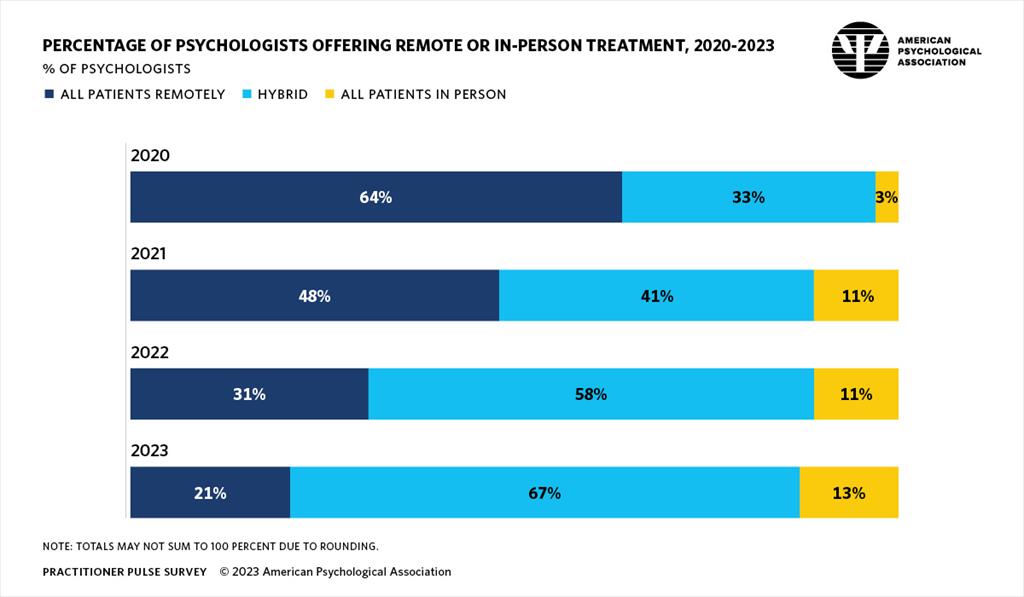
Figure 5: Percentage of psychologists offering remote or in-person treatment, 2020–2023. View a full-size version with detailed description of the treatment location infographic.
Psychologists saw increases across almost all marginalized groups, but gaps remain
Psychologists in 2023 reported seeing more patients from nearly all racial and ethnic categories compared with the previous 12 months, except for two racial/ethnic categories (Figure 6). Treatment rates of American Indian, Alaska Native, and/or Indigenous people as well as Native Hawaiian or other Pacific Islanders remained relatively unchanged. This finding is in keeping with previous research on psychologists’ experience working with American Indian/Alaska Native/Indigenous and Native Hawaiian/other Pacific Islander populations, further evidenced by more than half of psychologists reporting they do not treat any patients from these populations (55% and 59%, respectively).

Figure 6: Reported changes to patient demographics in the last 12 months, 2023. View a full-size version with detailed description of the changes in patient demographics infographic.
Nearly a third of psychologists (31%) reported seeing an increase in patients from working poor populations (Figure 7). LGBTQ+ populations also saw increases in treatment; 26% of respondents reported an increase in treatment of gay, lesbian, and bisexual populations and 41% reported an increase in treatment of transgender and gender non-conforming populations. Rates of decrease in treatment were marginal and remained between 2% and 8% for any given category.

Figure 7: Reported changes in patient populations being treated in the last 12 months, 2023. View a full-size version with detailed description of the changes in patient populations infographic.
Similarly, psychologists reported net increases in treatment access across all age bands, with some of the starkest increases observed in adolescents (Figure 8). While treatment of adults ages 26 and older is still increasing year over year, these rates are trending toward stabilization. For example, in 2022, 55% of respondents reported no change in their treatment of adults ages 26–49, and in 2023, that rate rose to 73%, suggesting that the annual rate of change is slowing. However, this trend toward stabilization is not evident among adolescents and children. Moreover, adolescents had the greatest reported increase in treatment in 2023, when 43% of respondents said they were treating more adolescents.
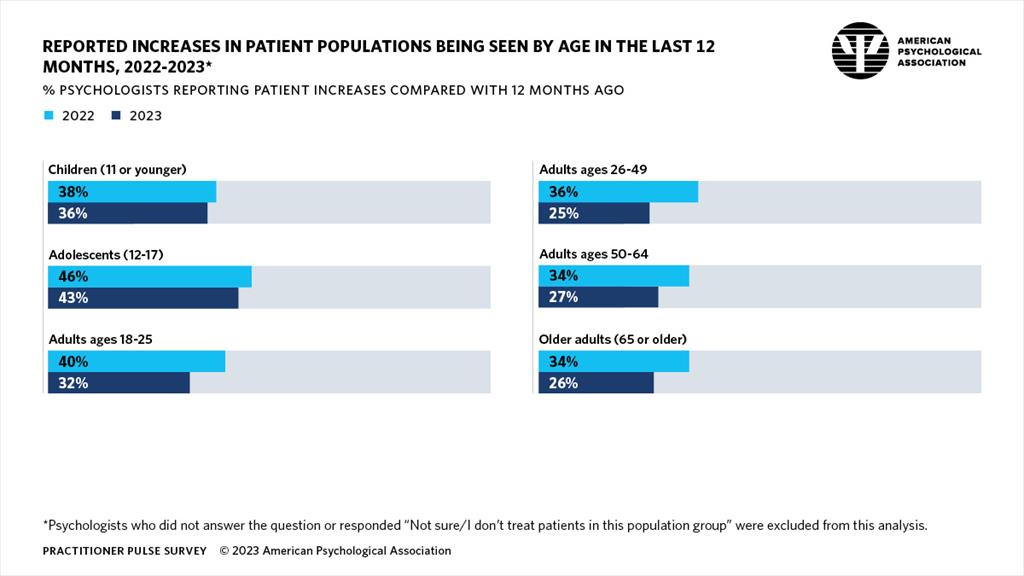
Figure 8: Reported increases in patient populations being seen by age in the last 12 months, 2022–2023. View a full-size version with detailed description of the increases in patient populations seen by age infographic.
Psychologists are involved in treating mental and physical health conditions, potentially as members of care teams
Alongside mental health concerns, psychologists reported treating patients with chronic pain (50%), obesity or weight conditions (42%), some symptoms of cancer (27%), and high blood pressure (25%). Similarly, psychologists reported seeing more patients with disabilities; 47% of psychologists reported seeing increases in patients living with long covid, 29% saw increases in patients living with chronic illness, and 27% saw increases in patients living with chronic pain.
This survey also introduced a question to gauge how often psychologists worked with different types of care professionals. More than 4 in 5 psychologists (86%) said they have worked alongside at least one of 16 listed professions, with 59% saying they do so frequently or very frequently. More than half (54%) frequently or very frequently worked with behavioral health professionals, 33% reported the same about health professionals, and 28% reported the same about both. Psychiatrists were the profession with whom psychologists most commonly worked, followed by licensed clinical social workers, psychiatric nurses and psychiatric nurse practitioners, mental health counselors and marriage and family therapists (Figure 9).

Figure 9: Professionals that psychologists have served with on care teams in the last 12 months, 2023. View a full-size version with detailed description of the psychologists and care teams infographic.
Press
- Download the report in printable format (PDF, 188KB)opens in new window
- Download the practitioner pulse survey methodology section (PDF, 102KB)opens in new window
- Download the practitioner pulse survey topline survey results (PDF, 346KB)opens in new window
- Press release: Mental health crisis highlights access challenges
Contact:
Sophie Bethune
(202) 336-6134